Reducing pipeline construction risk and cost
Harnessing predictive analytics to do more with less
An Enovation Perspective
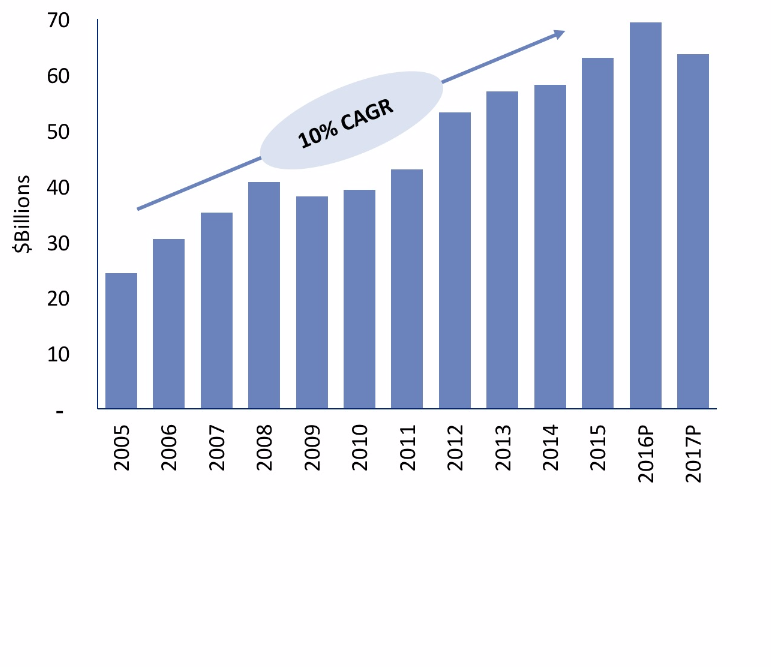
The North American midstream and local gas distribution (LDC) sectors are experiencing historic levels of growth
Capital expenditures for gas distribution companies have been increasing at ~ 10% for the past decade. This growth in assets is obviously essential to these companies’ core value proposition to investors. And the companies’ “license” to continue deploying this capital rests largely in the hand of state and federal regulators
For their part regulators and policymakers are ratcheting up the standards on gas industry construction and operating safety
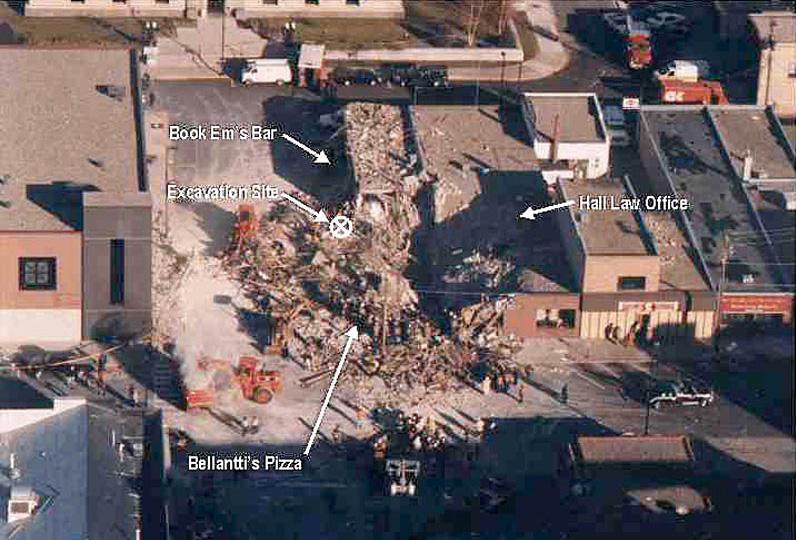
In response to the San Bruno incident, California issued significant fines and penalties (criminal and civil) and increased the level of PUC oversight over construction and operations and maintenance activities.
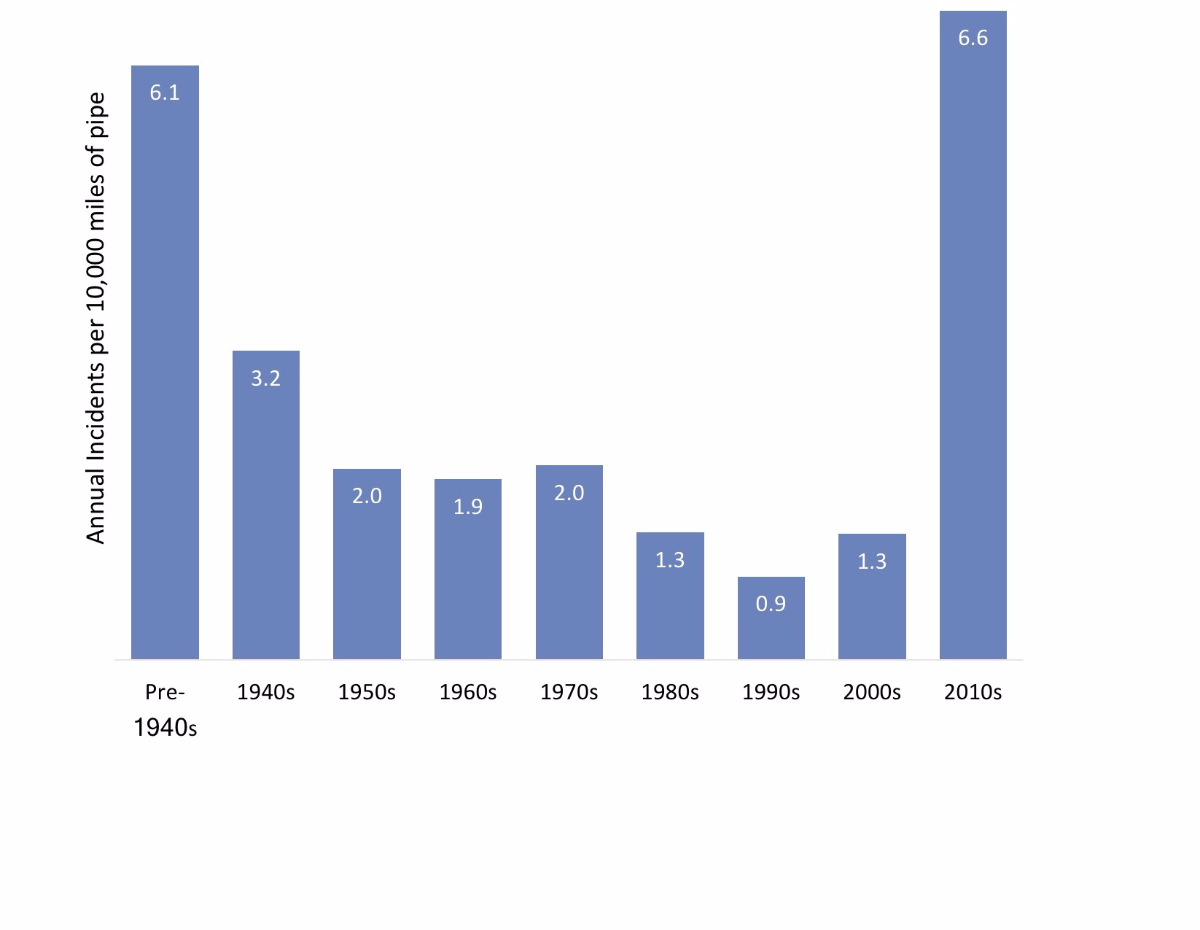
Policy makers’ desire for increased oversight is more than a sensational response to a handful of high profile tragedies; previous decades’ improvement in pipeline safety have reversed over recent years.
PUCs are also increasingly taking construction and operating safety into account in approving LDC mergers
The Illinois Commerce Commission approved the merger of Wisconsin Energy Corporation and Integrys Energy Group only after placing strong conditions for their accelerated pipeline safety and replacement program.
The primary federal regulator – PHMSA – is under increasing pressure to improve the rigor of its oversight. A GAO review published in August 2017 pointed out shortcomings in PHMSA progress on how it uses data on pipelines and corrosion to inform inspection priorities.
________________________________________
Source: ICC Approves Merger of Wisconsin Energy and Integrys Energy, www.icc.illinois.gov/press/; US Department of Transportation Pipeline and Hazardous Materials Safety Administration; Government Accountability Office, www.gao.gov/products/GAO-17-639
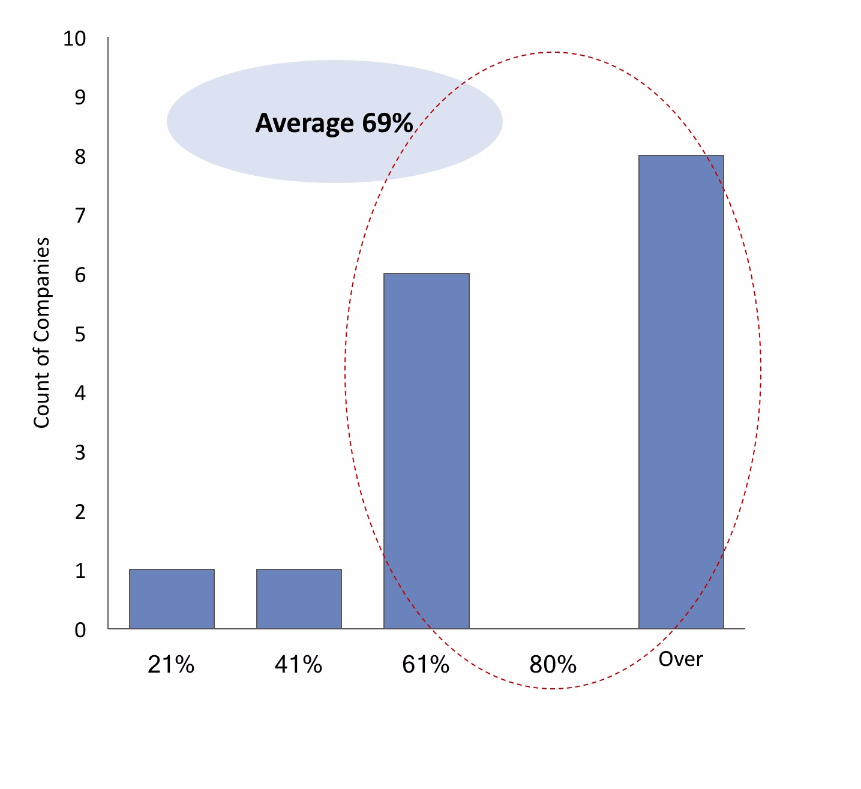
Gas Utility Reliance on Outsourced Construction Labor
Source: Enovation Partners analysis, AGA 2014 Labor Pool Mix survey
LDCs have been undertaking massive construction programs with a rapidly shrinking skilled labor force
Adding to the challenges of more stringent oversight (and penalties for failures), the qualified and experienced labor force is decreasing, with an expected 4.2% decline in line managers by 2024. This leads to greater reliance on outsourcing, potentially reducing LDC’s direct control over construction quality. Furthermore, many of the experienced inspectors and foremen who applied years of experience to ensure safe construction are retiring, and with their departure so goes their decades of expertise.
Source: Energy Workforce Demand Report (November 2015) by Center for Energy Workforce Development
Using digital inspection to improve productivity and reduce risk
Over the past three years, Enovation Partners has worked with many of the leading LDCs in the US to address this challenge. By leveraging mobile data, predictive analytics, and statistical quality assurance tools, our approach increases inspector and crew performance, construction quality, and field productivity, while reducing risk. The basic approach is summarized here.
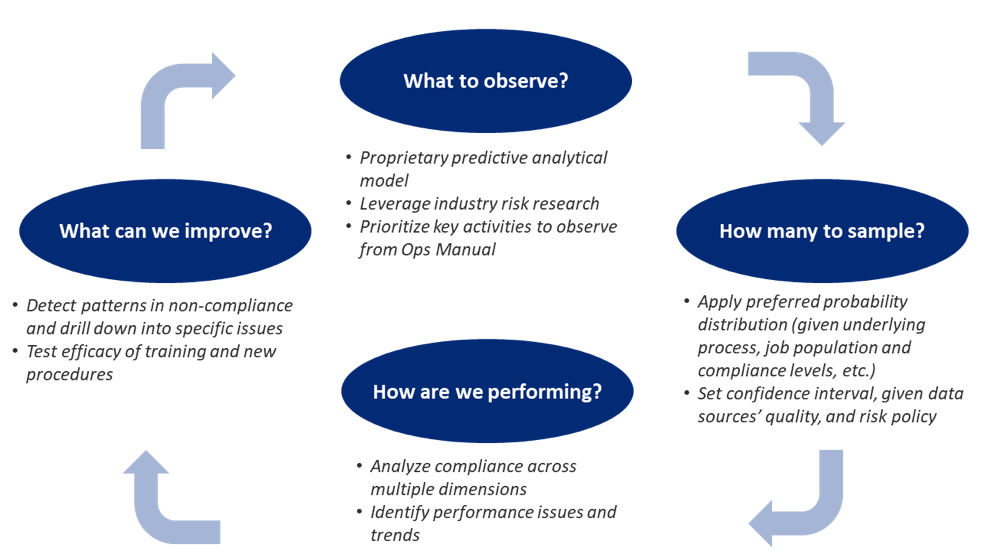
What to Observe?
Having reviewed the inspection practices of many US LDCs over the past few years, we have found programs are often driven by regulatory mandate and past practice rather than fact-based risk analysis.
Enovation, in collaboration with the Gas Technology Institute, has developed an empirically based model of the causes of pipeline incidents, incorporating a wealth of data from PHSMA, the Common Ground Alliance’s DIRT database, hundreds of LDC incident reports, and extensive interviews with pipeline engineers, safety experts, and materials scientists.
________________________________________
DIRT refers to the Damage Information Reporting Tool database (http://commongroundalliance.com/programs/damage-information-reporting-tool-dirt)
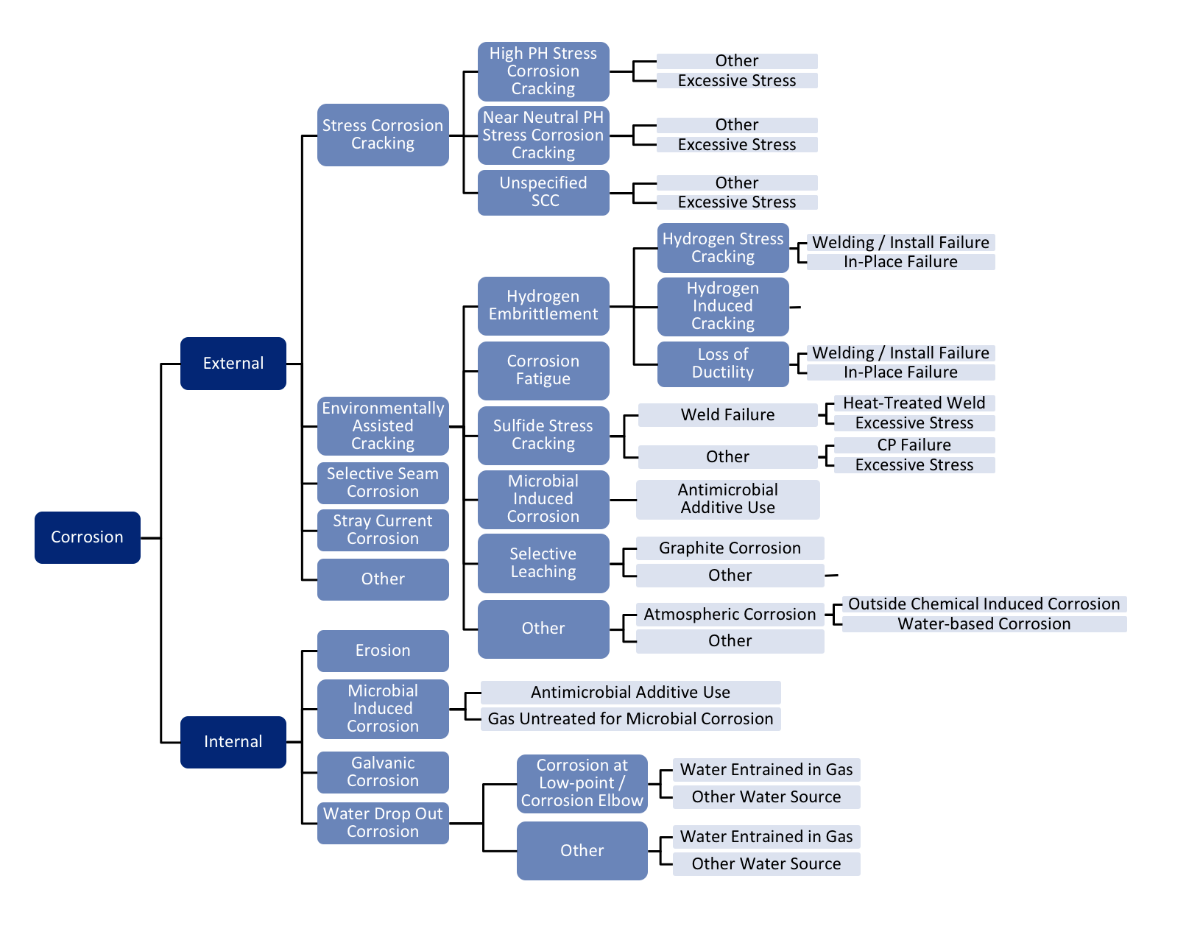
Corrosion Fault Tree -
Steel Distribution Main
The result is a highly granular “fault tree” which we use to help identify and prioritize which construction tasks are most critical to inspect to mitigate future pipeline safety risks.
Local factors – from physical environment (e.g., soil acidity) to LDC specific risk policies – are also integrated into this prioritization
Source: Enovation Partners and GTI
How Many to Sample?
All LDCs know their overall construction inspection “pass rates.” But how can they be sure that their inspectors are providing a truly representative snapshot of their construction performance… short of inspecting everything?
Enovation has developed and implemented the analytical tools that inform LDCs how many observations of which construction tasks are required. And we’ve partnered with technology providers such as Locus View to roll-out easy to use, mobile data collection tools, to make data collection easier and more reliable.
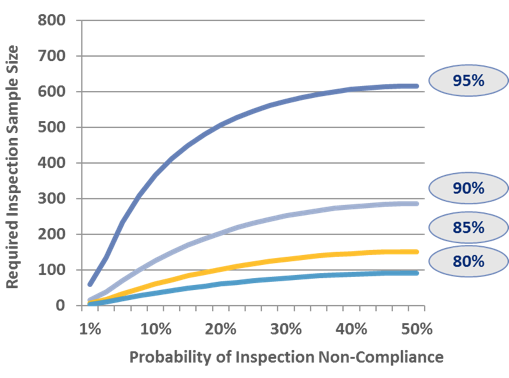
Defining Inspection Requirements
Enovation applies the lessons and quantitative tools of statistical quality control to calculate exactly how many observations are required to obtain the desired level of confidence of a company’s level of construction compliance.
Estimating required inspection sample size involves three inputs: the number of construction events expected over time, the expected fault rate, and the desired confidence interval.
How Are We Performing?
Enovation has developed a highly configurable set of reporting tools – available to inspectors on their mobile device, or to systems planners, engineering, risk compliance, and construction crew managers, etc.
Identify the root cause of performance issues or improvements, as in the case of tracking work training performance. The tools can be used to distinguish between purely “chance” errors versus persistent, “real” differences in contractor team performance.
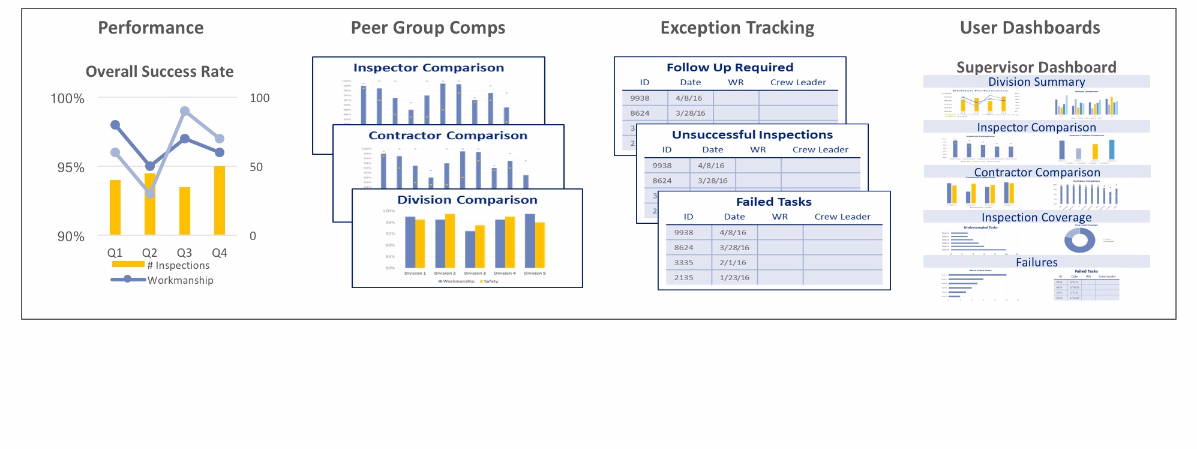
Performance Tracking Dashboards
These data are also used to update the LDC’s understanding of the sources of construction-related risks (i.e., the predictive mode from above), to continually improve inspection practices going forward. They can also be used for nearly real-time problem solving to address construction performance issues.
How Can We Improve?
Identifying issues in an LDC’s construction practices is important, but even better is providing the information needed to improve those practices moving forward, reducing risk and saving time.
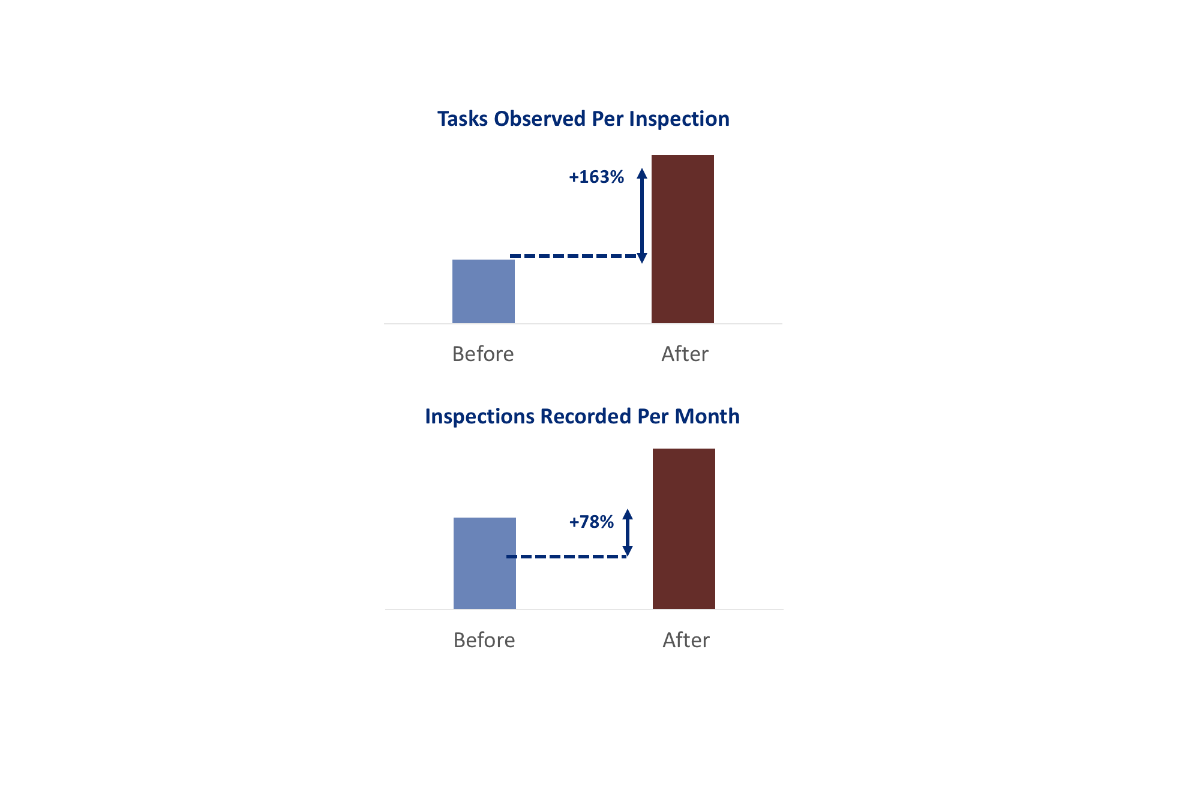
Enovation’s approach to making inspection more digital has the immediate benefit of making construction inspectors more productive. Digital tools enable faster and more accurate data entry, better targeting of inspection activities, and more robust targeting of what and how to inspect has reduced overtime and site delay.
Productivity Increases
The highly granular data used to analyze inspection results has also led to indirect but substantial (i.e., 5% - 12%) improvements in crew productivity.
Much of this stems from applying lessons from the data to “do the job right the first time”, targeting training and supervisor intervention into problem areas, and resulting in reduced on-site rework, reduced call outs for repair, and lower overtime.